98,173Bombing / explosion incidents
1.77Mean fatalities per incident
47% of all incidents, and the lowest lethality per event of any major method. Bombings do produce the most wounded — 401,951, more than every other method combined.
A fifteen-point Tableau story over 209,097 recorded incidents, 203 countries, 1970 to mid-2021.
Built for Data Visualization for Business Intelligence at NYU, working with the Global Terrorism Database — an open research dataset maintained by the START consortium at the University of Maryland.
The dataset is large, unevenly documented, and easy to describe badly. The work was as much about deciding what could responsibly be claimed as about what to plot.
Open the story on Tableau Public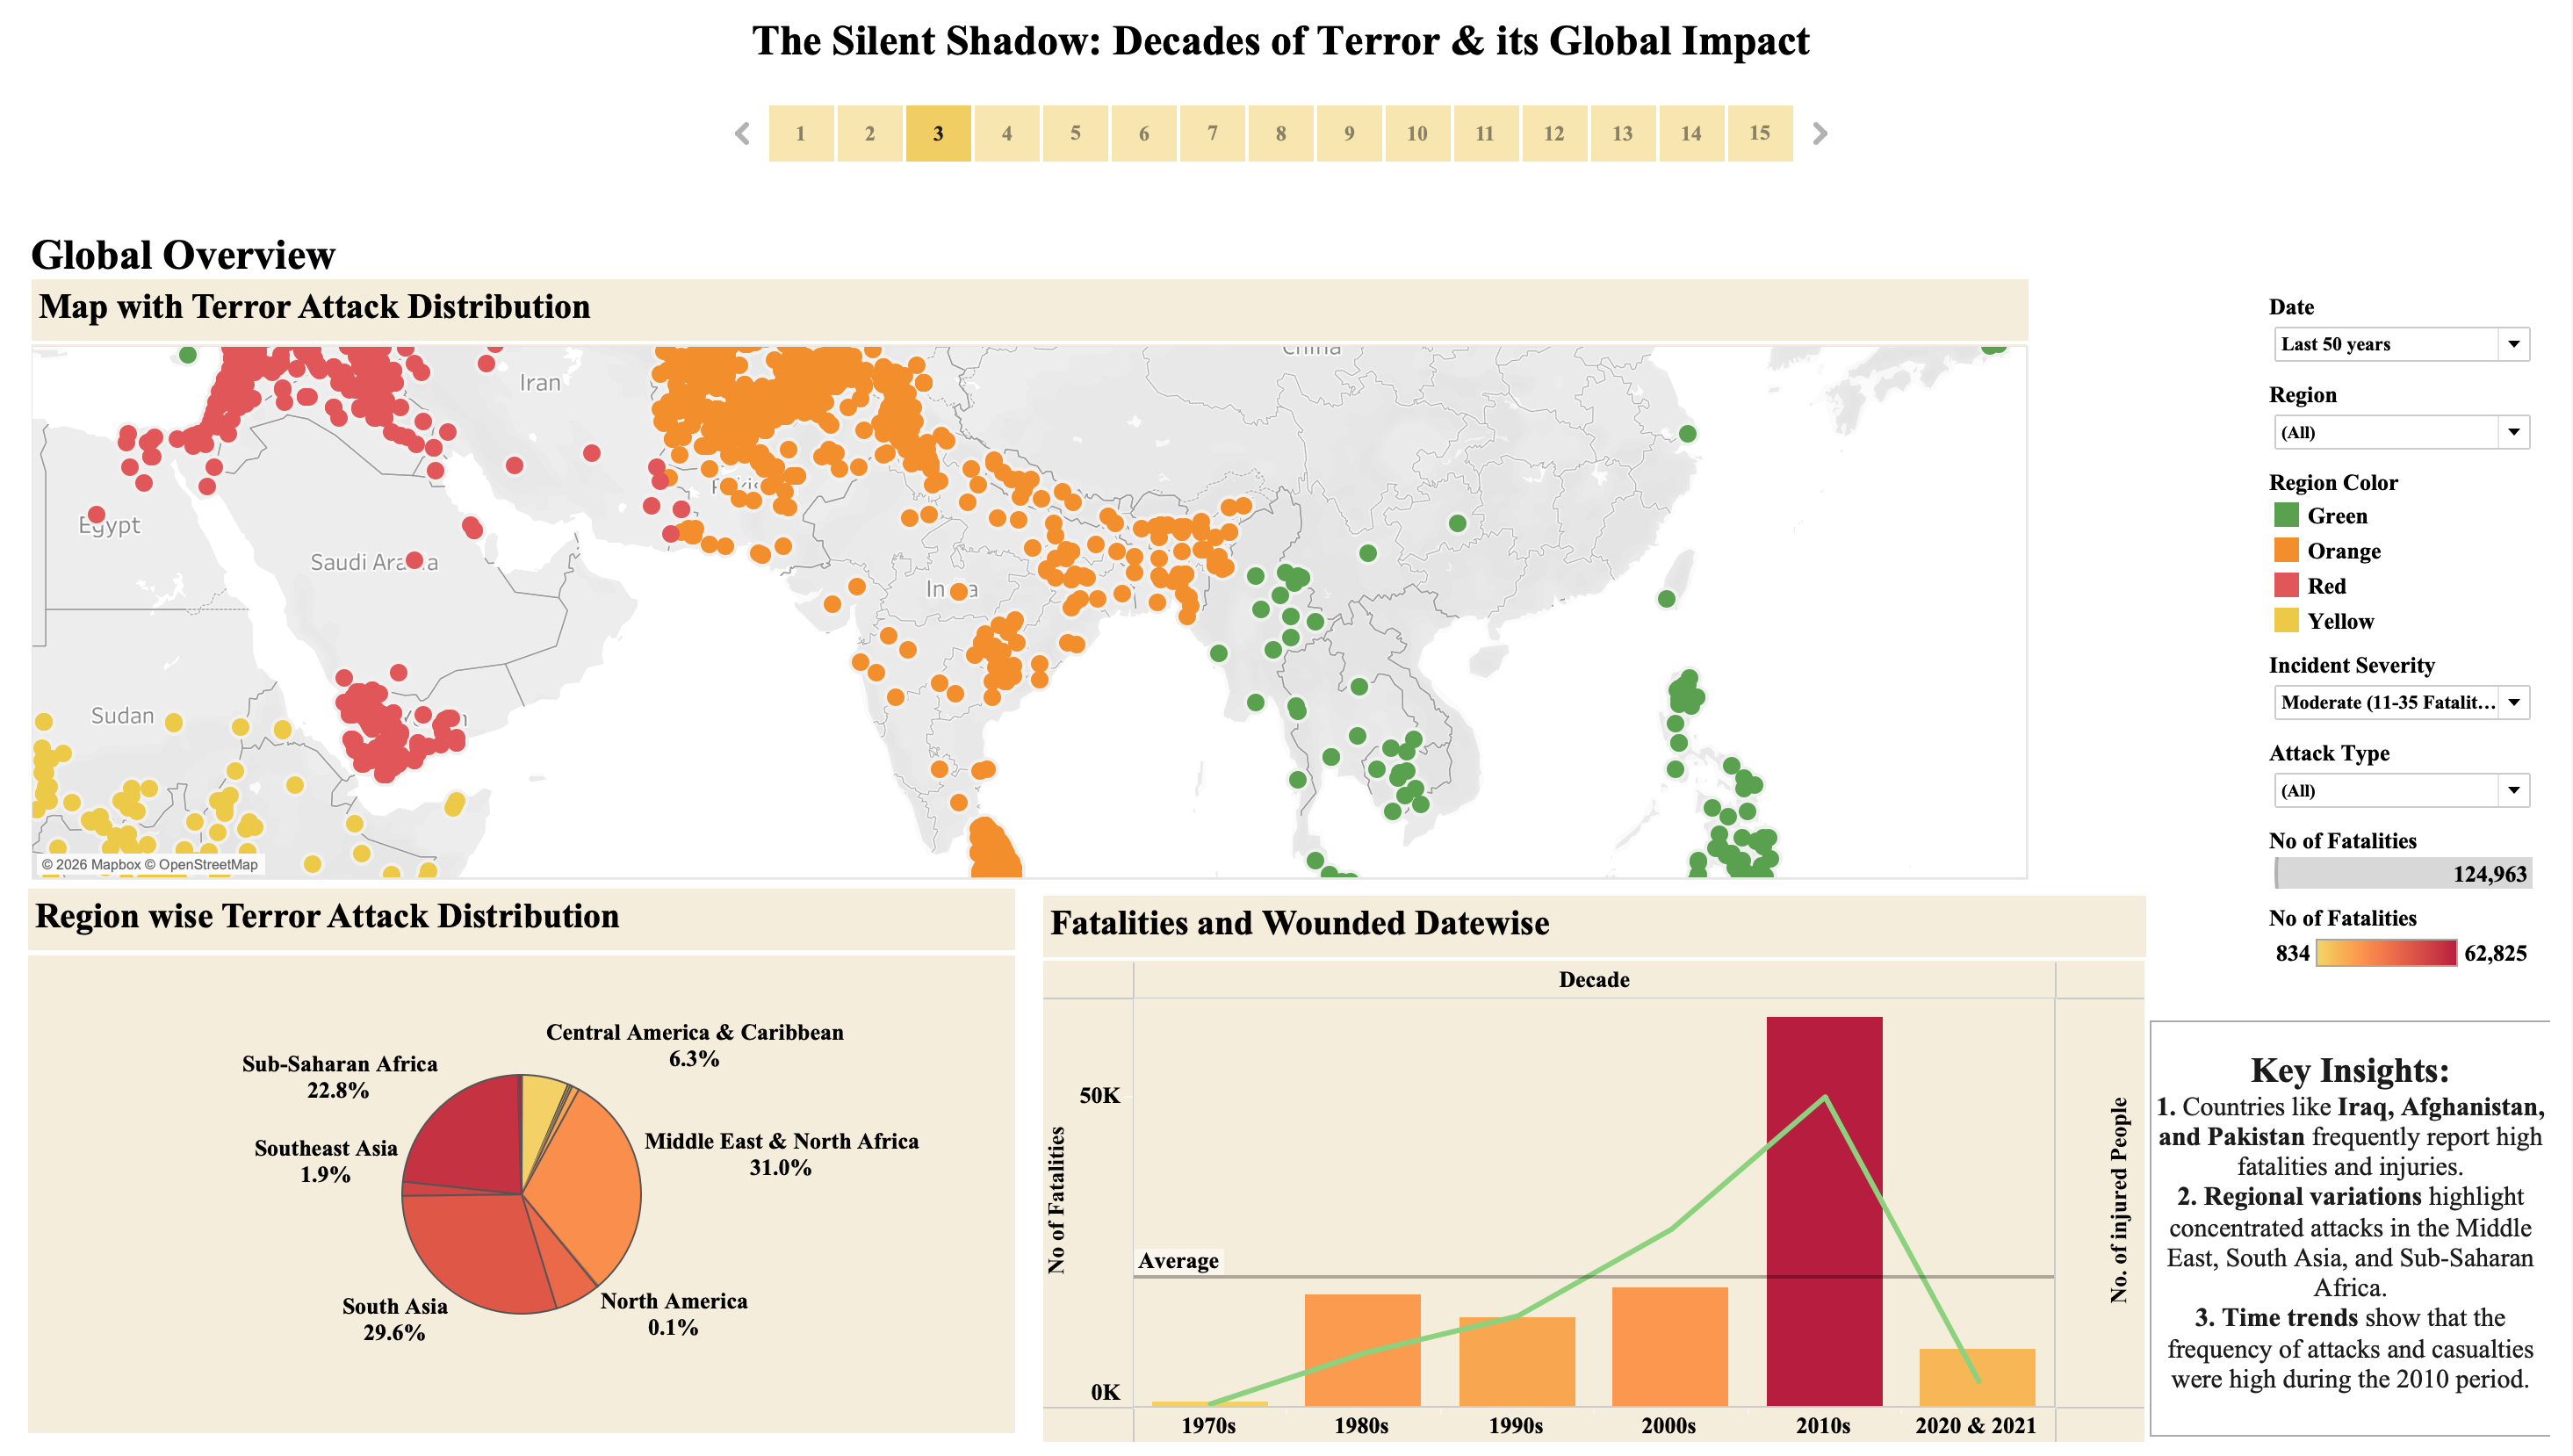
The GTD runs to 209,097 rows across 135 fields. Any single summary of it is a choice, and most obvious summaries mislead. Rank countries by incident count and you get one answer; rank by fatalities and you get another. Plot incidents over time without accounting for how the data was collected and you describe reporting practice rather than events.
The brief was a dashboard. The actual work was deciding which comparisons the data could support, and being explicit about the ones it couldn't.
Every view answers one
question — and says what
it cannot answer.
Bombings account for 47% of all recorded incidents — and rank near the bottom by average fatalities per incident. Armed assault is half as frequent and twice as deadly per event. This is what a lethality view surfaces and a frequency table hides.
47% of all incidents, and the lowest lethality per event of any major method. Bombings do produce the most wounded — 401,951, more than every other method combined.
Half the frequency, double the fatalities per event. Hijackings run higher still at 5.08 — but on 738 incidents, too few to rank beside the rest.
Means are computed across all incidents of each type, including those with no recorded casualties. GTD casualty figures are best-available open-source estimates and are revised as reporting develops.
105,662 incidents — 50.5% of the entire 51-year database — fall in the 2010s, peaking at 16,849 in 2014. By 2019 the annual figure had halved to 8,508.
This is partly a change in events and partly a change in observation: the GTD revised its collection methodology in 2012, and open-source coverage of conflict regions expanded over the same period. The chart shows the record, not the world. Treating the 1970s' 9,409 incidents and the 2010s' 105,662 as directly comparable would be a mistake.
The Middle East & North Africa and South Asia together account for 114,317 incidents — 55% of the total. Five countries account for roughly a quarter: Iraq (27,880), Afghanistan (20,253), Pakistan (15,563), India (13,976) and Colombia (8,455).
The story's regional view sharpens this further by filtering to moderate-severity incidents, where MENA reaches 31.0% and South Asia 29.6% of the share — a reminder that the regional picture shifts depending on whether you weight by incident or by casualty.
A pair of views compares countries where incidents fell most over two decades against those where they rose. Algeria, Colombia, Sri Lanka and Peru lead the reductions; Iraq, Afghanistan and Pakistan dominate the increases, with Iraq alone accounting for roughly 15,000 more incidents.
Both charts carry a Top N slider and an attack-type filter, so a reader can test whether a country's trend holds for bombings specifically or only in aggregate.
Seasonality was one of eleven planned analyses. There is no meaningful signal: Spring 55,921, Summer 54,225, Autumn 49,841, Winter 49,110 — a spread of about 12% between highest and lowest quarter, across both hemispheres and every climate.
The view stayed in the workbook. A flat result is still an answer, and cutting it would have left the impression the question was never asked.
GTD 1970–2020
GTD Jan–Jun 2021
Codebook
Union · field selection
39 working columns
Eight, each with
filters and Key Insights
Fifteen points
Published, interactive
The GTD ships 135 fields. We selected 39 supporting the planned analyses — event, location, method, target, perpetrator, casualties and damage — and dropped the rest rather than carrying dead columns into Tableau.
The 2021 partial-year release is distributed separately from the 1970–2020 file. Unioning them gives continuous coverage at the cost of a final year covering only January to June — which every time view has to account for.
Fifteen sequenced story points rather than one dense dashboard. Each carries its own filters, a Key Insights panel stating what the view supports, and where the controls are non-obvious, an interactivity guide telling the reader how to drive it.
The GTD holds no records for 1993 — the original data was lost before digitisation and has never been recovered. It is not a quiet year in the charts; it is a hole. Any year-over-year comparison spanning it is invalid, and a trend line through it is drawing across missing data rather than low values.
Nearly half the database records the responsible group as unknown. Any ranking of groups is therefore a ranking of attributed incidents only — and attribution is itself uneven, better documented in some regions and periods than others. The named leaders in this data are the most-attributed, which is not the same as the most active.
The GTD is compiled from open-source reporting. Its collection methodology changed in 2012, and media coverage of conflict regions has not been constant across five decades. A rise in recorded incidents is consistent with more events, better reporting, or both, and this dataset cannot separate them.
The final data point covers January to June 2021. It is included because dropping it would silently discard six months of records, but it cannot be read as an annual figure — in any yearly chart it appears as a fall that is an artefact of the cut-off.
Fifteen interactive story points over 209,097 records, public and explorable.
The useful output was less the dashboards than the discipline around them: a frequency ranking and a lethality ranking that disagree, a seasonal analysis that found nothing and said so, and four documented limits on what the data supports.
Normalise incident counts by population and by a media-coverage proxy before comparing regions and decades — raw counts conflate events with observation. Build the 1993 gap into the charts explicitly rather than leaving readers to notice it. And relabel the paired trend views: both share a "reduction in attacks" axis, so the rising-incident chart plots negative reductions, which reads backwards.
Source: Global Terrorism Database, maintained by the National Consortium for the Study of Terrorism and Responses to Terrorism (START) at the University of Maryland. Coverage 1970 – June 2021, excluding 1993. The GTD applies its own published inclusion criteria — an incident must be intentional, entail violence or the threat of it, and be carried out by a sub-national actor — and records are compiled from open-source reporting, so the database reflects documented incidents rather than a complete record of events. Casualty figures are best-available estimates. Team project for MG-GY 6203, Data Visualization for Business Intelligence, NYU, with Abinanthan Kathiresan and Preethi Ravichandran.