PAPrathamesh Adarkar
EXCEPTION DESK / ALERT CORRELATION / TRADING OPERATIONS

One fault,forty alerts.

A vendor price file misses its 05:10 window. Six people get paged. That is one incident, not forty — and the two loudest alarms are both false.

I built a correlation engine over a 30-service trading stack that collapses an alert storm into incidents, ranks the likely cause against the dependency graph, and scores itself against known ground truth. Then I wrapped it in a shift simulator, so you can take the desk yourself and find out how long it takes you.

The decision the project is built around

Or take the shift.

ROLE

Topology design, correlation engine, evaluation, simulator

BUILT WITH

Python · NetworkX · JavaScript · Vercel Edge

SCALE

30 services · 58 dependencies · 258 alerts · 8 scenarios

01 / THE STORMAll data synthetic · faults injected at known nodes
30Services in the graph
58Dependency edges
258Alerts across 8 scenarios
5Playable shifts
01

The two loudest alarms
are usually the false ones.

A vendor file misses its window. The loader fails, pricing serves stale marks, risk evaluates limits against those marks and throws a breach, P&L flags an 8-sigma move that never happened, and reporting goes out with yesterday's prices.

The risk breach and the P&L spike are the two alarms that page people at 05:12. Both are false, and both sit three hops downstream of anything that actually broke. The operator's real job is not reading alerts — it is working out which one is the cause.

Alerts per scenario258 alerts generated across eight scenarios.ALERTS GENERATED PER SCENARIO · 258 TOTALflapping_latency109airflow_dag_cascade35db_pool_exhaustion32vendor_price_file_late26two_independent19fix_session_drop16stale_fx_feed15missed_corporate_action6Faults are injected at known nodes, so the right answer is known for every one of these alerts. That is what makes the scoring real rather than decorative.
The decision everything else follows from

Classification is deterministic.
The model only writes prose.

Grouping, correlation, root-cause ranking, check findings and scoring are all rules — over a dependency graph, a fixed answer key, or arithmetic. Every ranking comes back with reasons: plain strings a human can check.

upstream of 7 of 9 alerting services

A reason a human can verify against the graph in ten seconds. The model never sees this decision.

Fault propagationThe root cause vendor_px_equity propagates through ingest_px_loader and the silent svc_pricing to svc_risk and svc_pnl, the two loudest and both false.ONE FAULT, PROPAGATED · vendor_price_file_latevendor_px_equityroot cause · 05:17ingest_px_loaderalerted · P2svc_pricingnever alertedsvc_riskalerted · P1svc_pnlalerted · P2the two that page peopleboth false · three hops downstreamhealthy by itsown monitoringAn induced subgraph on alerting services finds no edge here and splits one incident into several. The link runs through svc_pricing, which is fine.

The path the engine walks on the baseline scenario. svc_pricing carries the fault from the loader to both false alarms and never alerts itself — which is why the incident split has to run on reachability through the graph rather than on edges between the services that happened to shout.

02

What the model
is actually for.

It takes the engine's output and writes the incident summary, the broker escalation and the handover note. It never decides what the root cause is, never decides what a diagnostic returns, and never scores the run.

On an operations desk you have to be able to say why something was escalated, and "the model thought so" is not an answer. Knowing where not to put an LLM was the design position the whole project is built around.

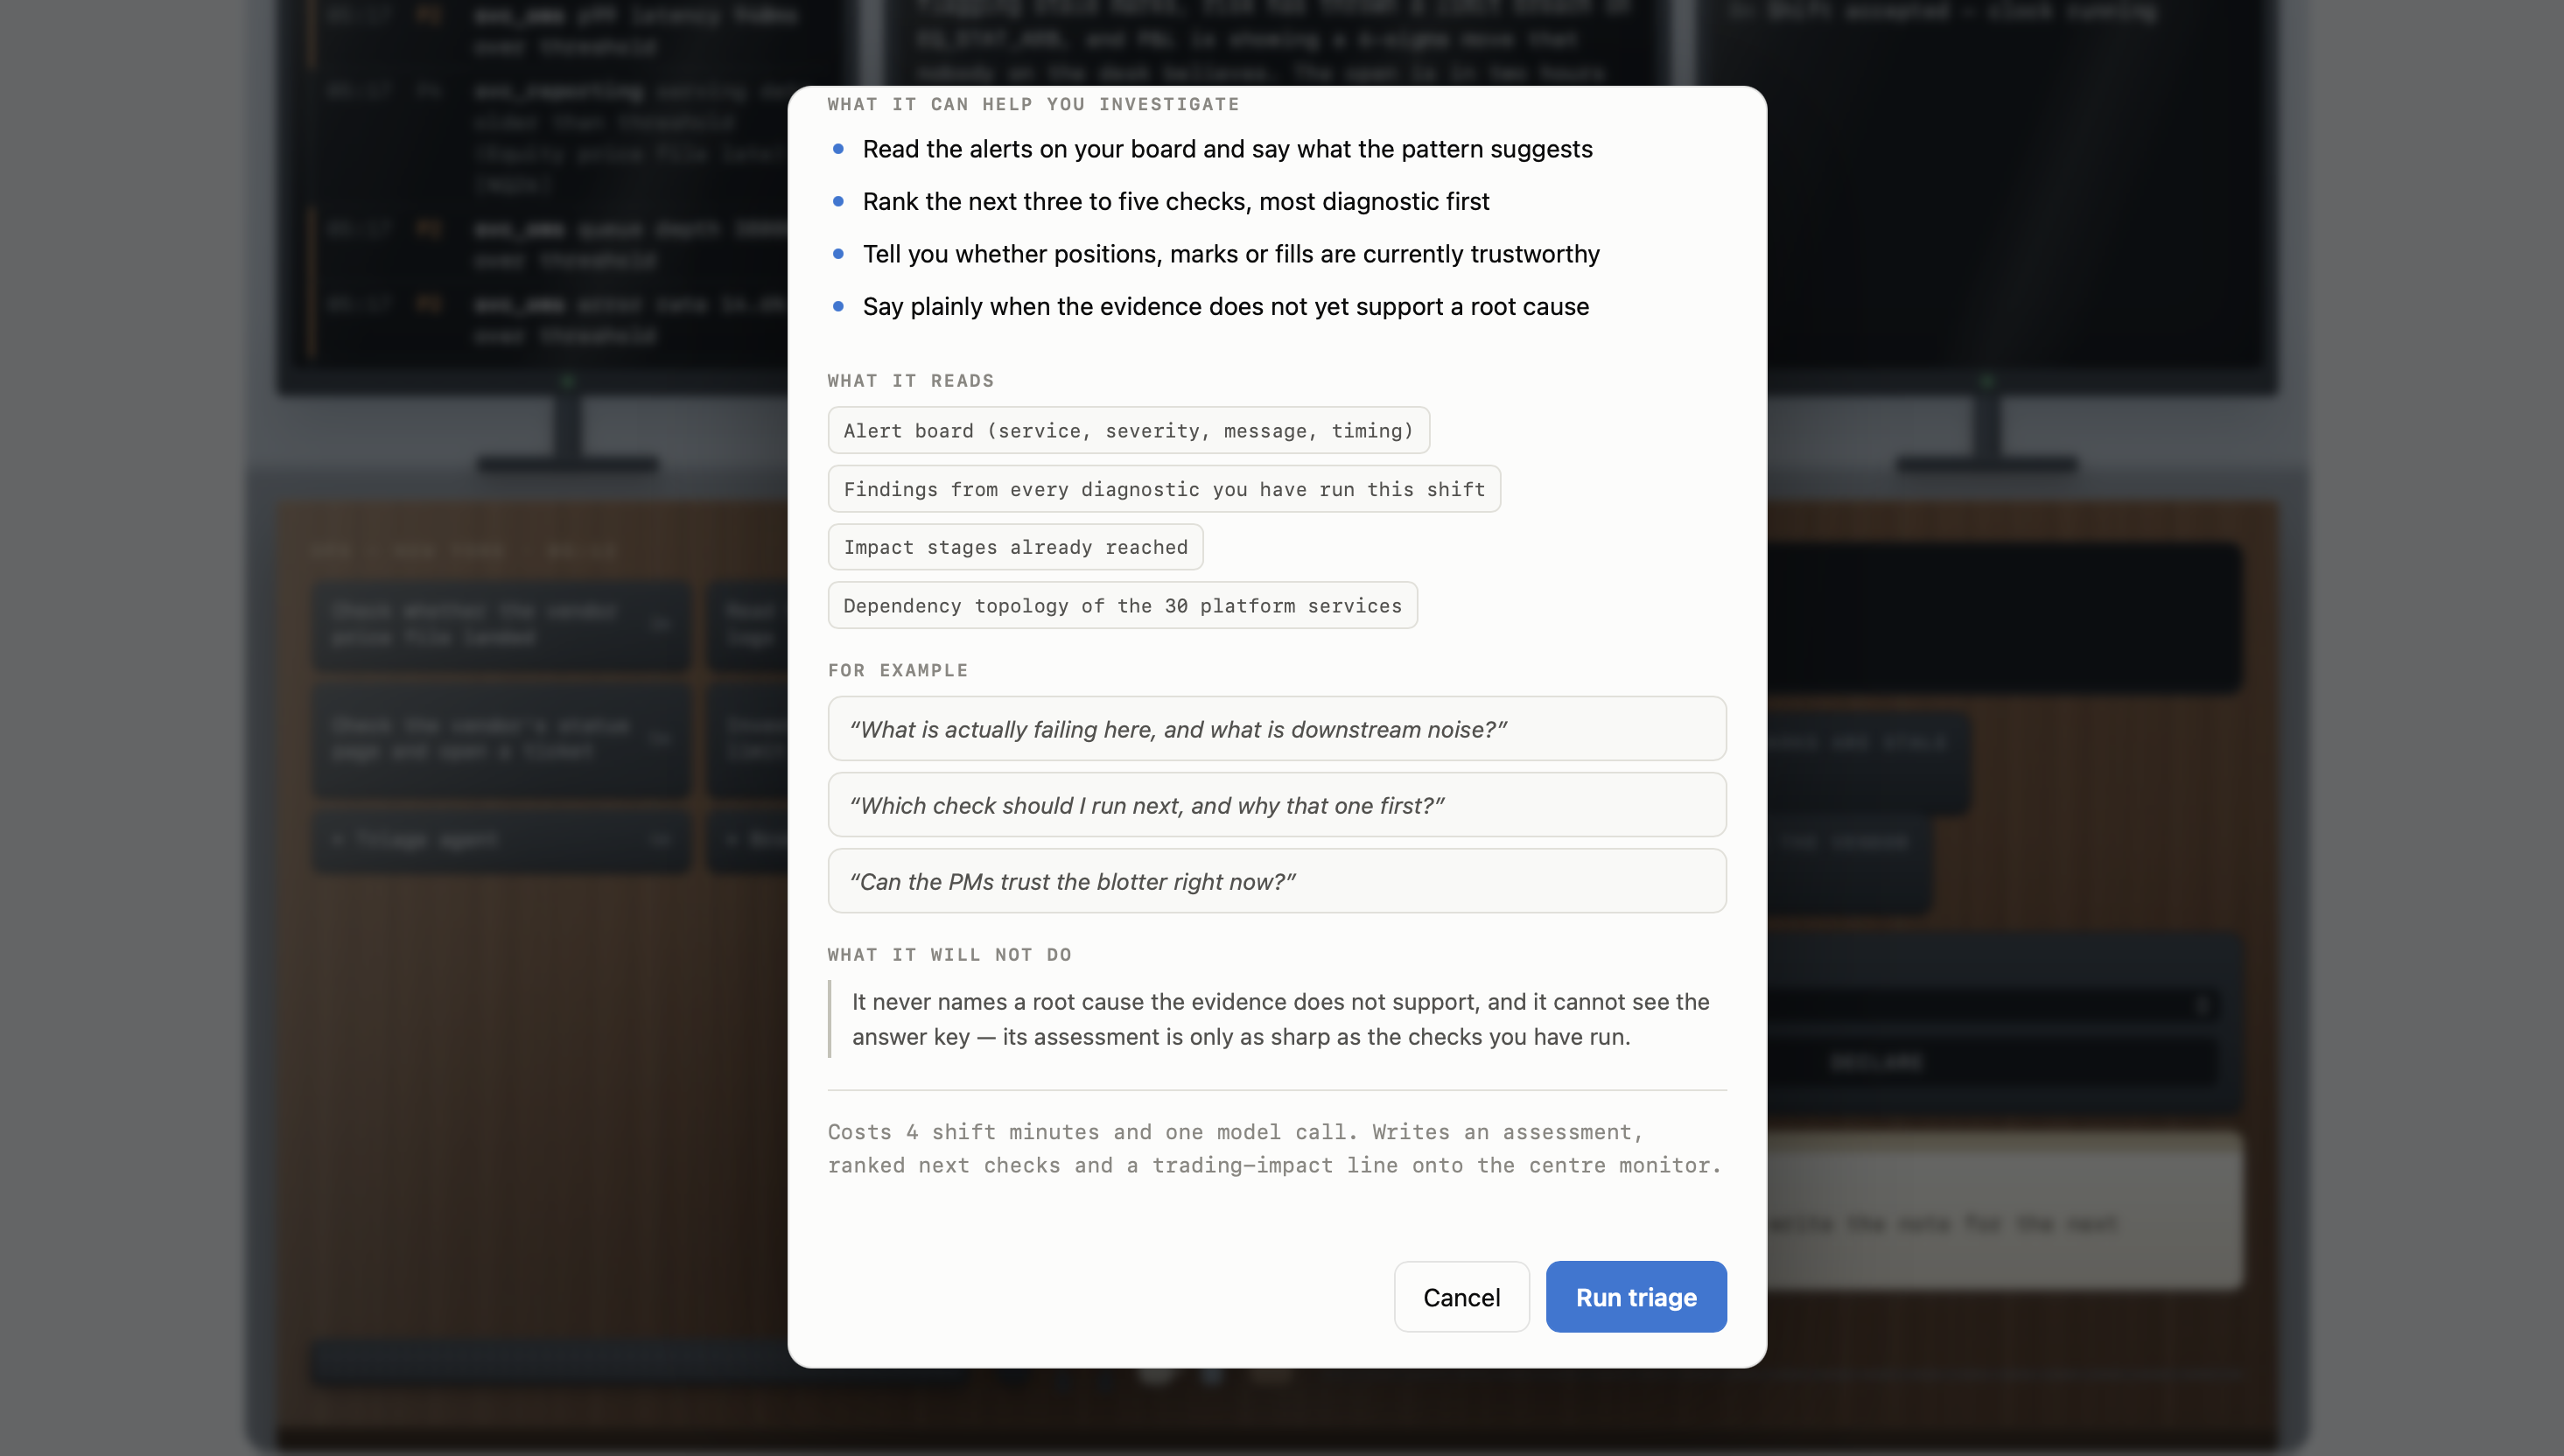
TRIAGE AGENT · THE CONTRACT4 shift minutes · one model call
The triage agent dialog listing what it reads, example questions, and a section headed What it will not do: it never names a root cause the evidence does not support and cannot see the answer key.
The agent states its own limits before you spend a minute on it — what it reads, and that it cannot see the answer key. Every agent in the app carries a panel like this.

Each scenario exists
to punish one of them.

01

Timestamps carry no signal

In db_pool_exhaustion, eight services fail within four seconds. Arrival order is noise at that resolution. Only the graph resolves it: db_primary sits upstream of sixteen services, and the seven others that alerted are all downstream of it. Upstream coverage over what actually alerted is what separates a cause from its symptoms.

02

The root can alert last

In stale_fx_feed, the vendor's own staleness check is slower than the downstream P&L check — so the root cause alerts seven minutes after its own symptoms. Any engine leaning on "earliest alert wins" gets this wrong and cannot be argued out of it. That is why earliness carries the lowest weight of the three signals.

03

Adjacent in time, unrelated in fact

In two_independent, a late locate file and a broken FIX session land 4.35 minutes apart — overlapping in time, disjoint in the graph. The fix was to make the split topological rather than temporal: two services belong to the same incident only when a directed dependency path runs between them.

Two decisions sit inside that. Reachability, not induced subgraph — the service linking two symptoms often does not alert itself, so an induced subgraph finds no edge and over-splits. And no linking through a shared ancestor — almost everything here is eventually downstream of db_primary, so treating a common ancestor as a link collapses the estate into one component and merges exactly the case this is meant to separate.

Found by running the signals by hand

Two services the ranker
could not tell apart.

service                   cover  early  blast  fired   score
fix_gw_broker_b            0.69   1.00     10      1   0.846
msg_bus                    0.69   0.93     10     12   0.833  <-- TRUE ROOT
margin between top two: 0.013

msg_bus and fix_gw_broker_b have identical upstream coverage and identical blast radius — their downstream sets in this topology are nearly the same. The tiebreak fell entirely to earliness, and the wrong service won it because one background alert happened to land first.

A

Lowering the weight doesn't fix it

Reducing the earliness weight converts a narrow loss into a tie, and a tie broken by service name is not a heuristic. The problem was not the weighting — it was that no signal in the original design read the distinguishing fact.

B

The fact was in the data all along

msg_bus fired 12 times across the window. fix_gw_broker_b fired once. A service that is genuinely broken keeps complaining, and nothing in the three original signals was reading repetition.

C

A non-determinism bug worth recording

A baseline ranker flipped between right and wrong across runs of an unchanged repo. networkx.connected_components yields sets in an unstable order and the ranker sorted on score alone, so 0.013-apart ties broke on dict iteration order. Both are now sorted deterministically, with a test that runs the pipeline twelve times and asserts identical output.

The caveats are part
of the result.

01

Everything is synthetic

The topology, failure modes and propagation are modelled on how systematic trading operations break. No real market data, broker relationship or firm system is involved. Injected faults propagate more cleanly than reality does, and the engine has never seen a genuinely ambiguous incident.

02

The topology is plausible, not authoritative

It is hand-built from how I understand a trading stack to fit together. A real estate would be messier — cycles, undocumented dependencies, services nobody owns. Every result here is a result about this graph.

03

Ground truth is kept away from the engine

The answer key lives in a separate file from the alert stream, so the correlation engine cannot read it even by accident. That separation is deliberate and it is the first thing worth checking in the repository. The pipeline is also tested independently of the heuristic — test_pipeline.py injects a stand-in ranker, so clustering quality is verified without depending on which service gets named.

06 / TAKE THE SHIFTGitHub ↗  ·  Open in a new tab ↗

The engine is the substance.
This is how you show it.

Five shifts, each a real failure mode, each punishing a different instinct. A clock runs and every move costs minutes — run a diagnostic, warn the portfolio managers, declare a root cause, write the handover. Damage accrues while you deliberate.

Scoring is deterministic wherever it can be: time to correct root cause, whether the PMs were warned before the impact threshold, whether dead-end diagnostics were run. Only the handover note is model-graded, and even there the grader is handed an explicit checklist of what the next region needed, so its judgement is checkable.
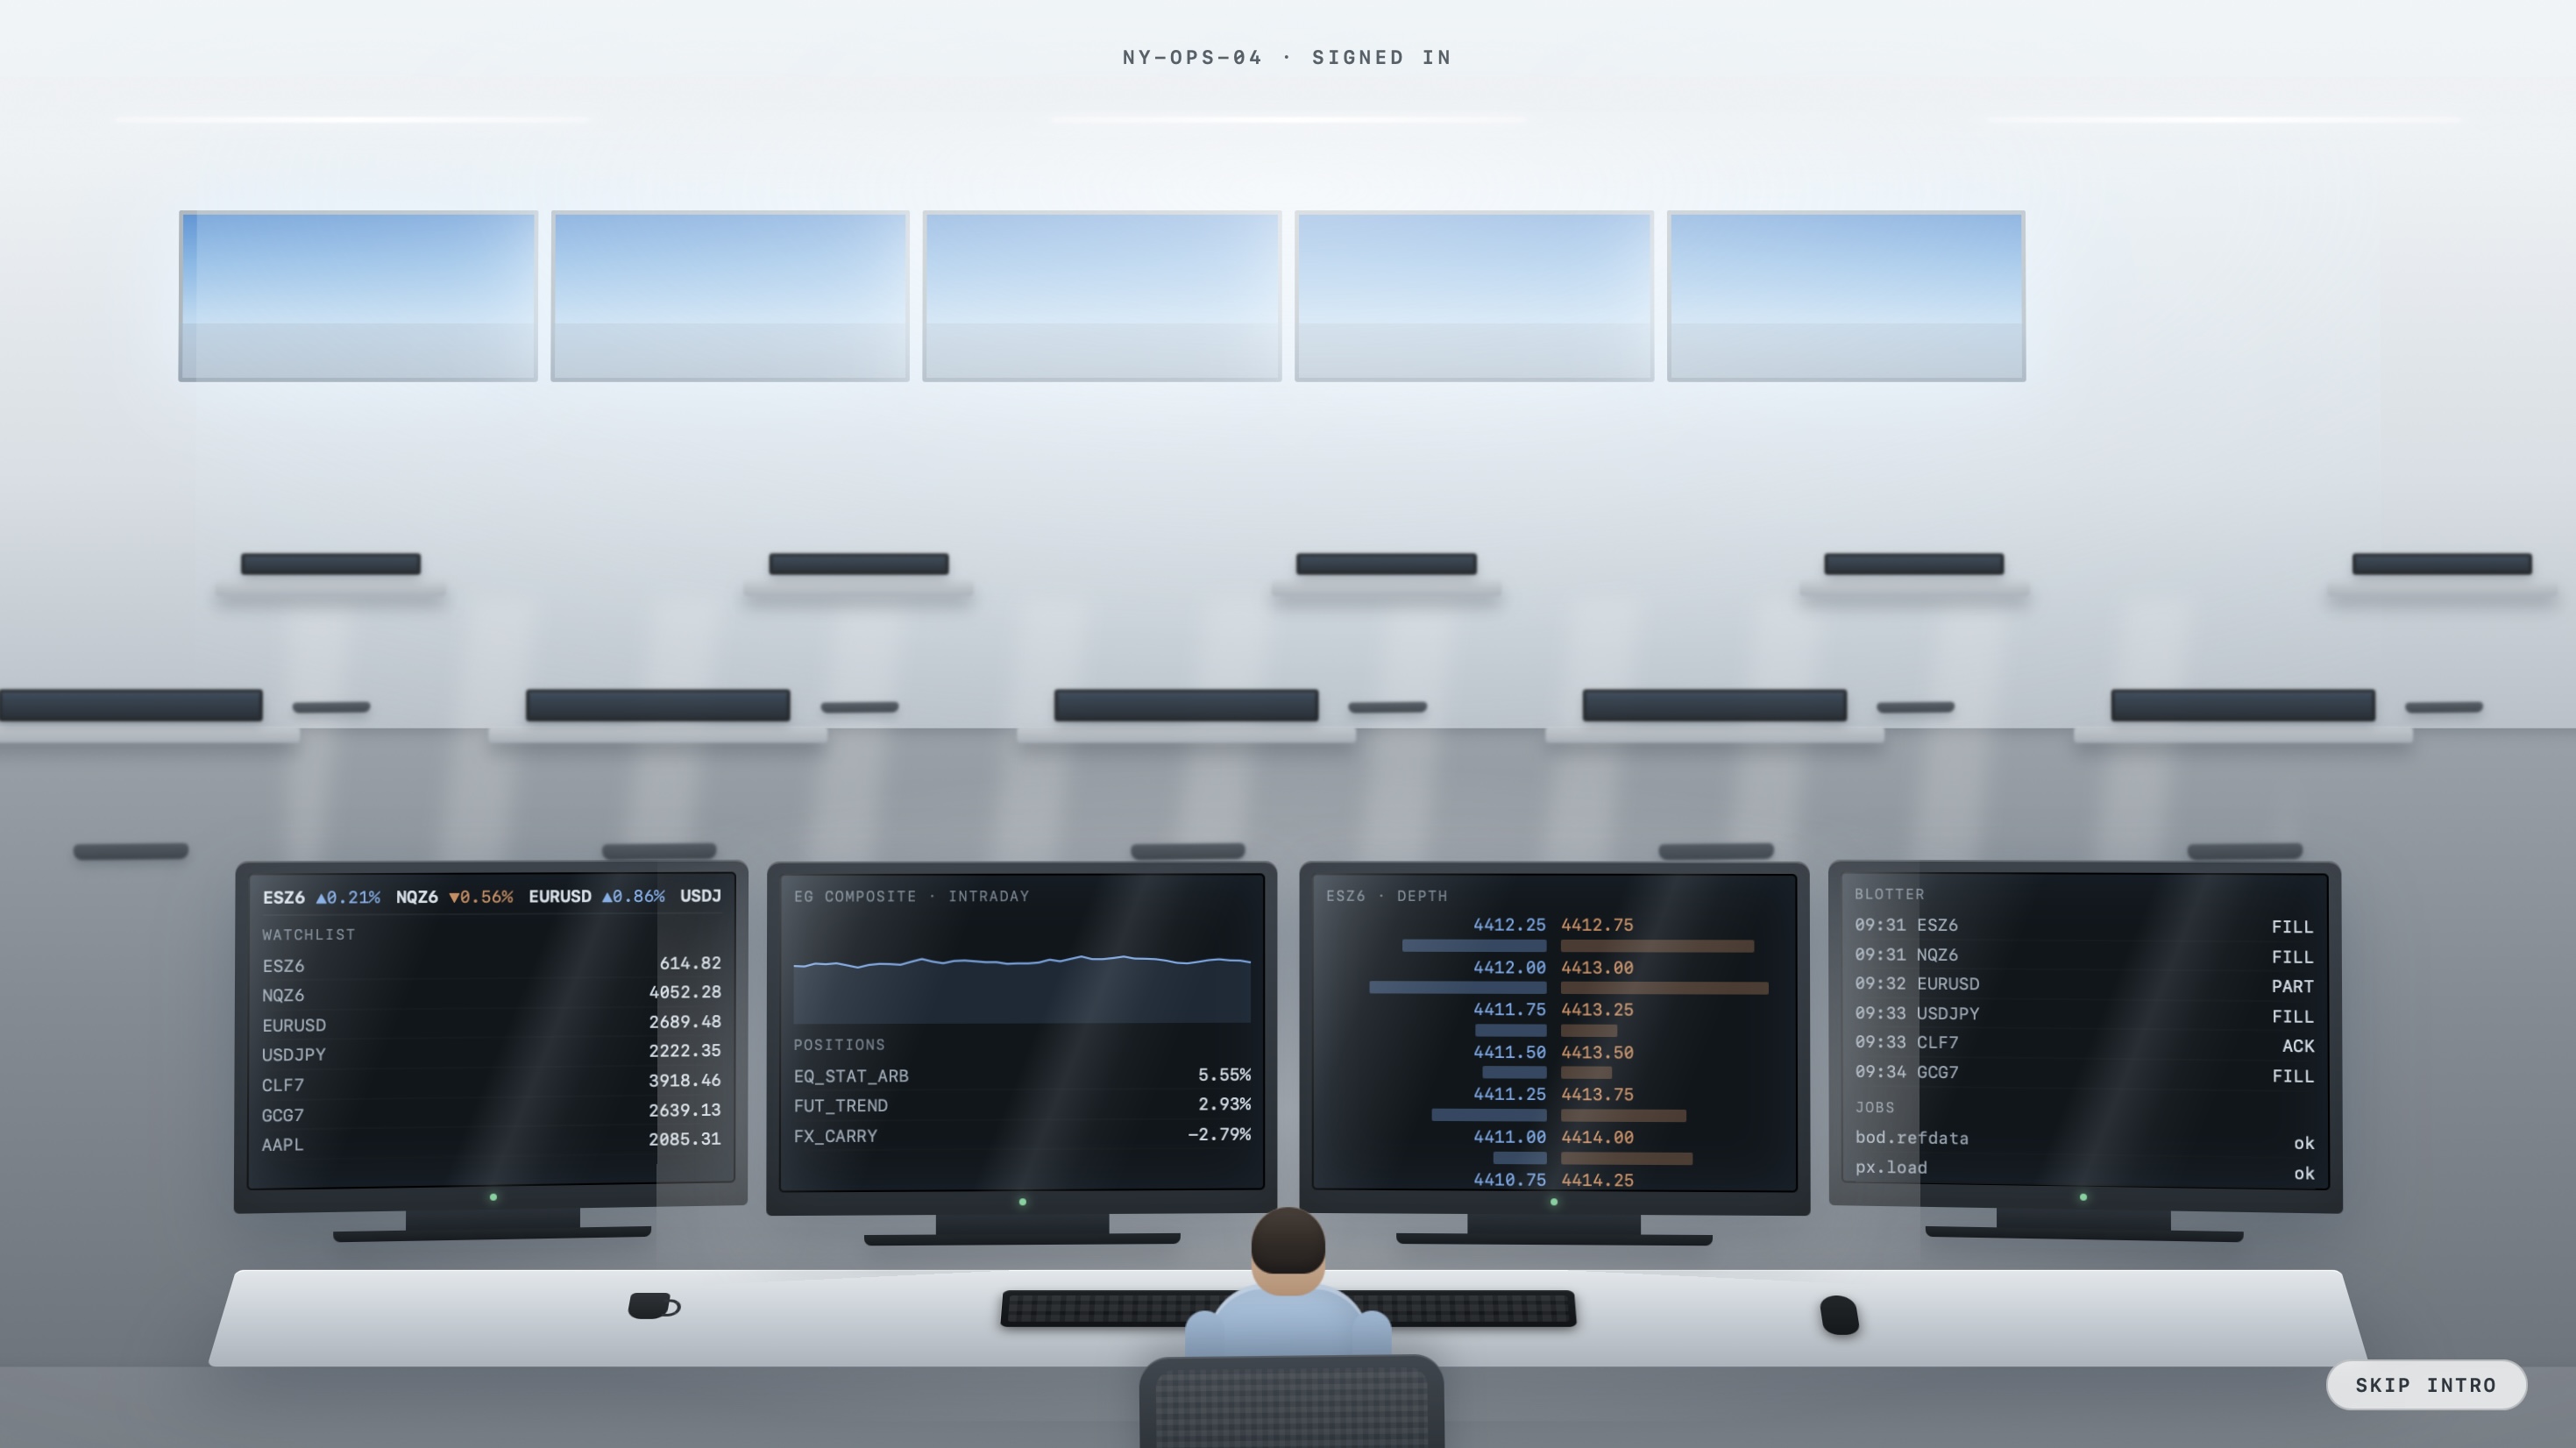
00:00 · THE FLOOR, BEFORE THE SHIFTNY-OPS-04 · signed in
A wide view of a quiet trading operations floor: rows of empty desks, a wall of screens, and one operator at a four-monitor desk showing a watchlist, an intraday chart, order-book depth and a blotter.
Before anything breaks. Prices tick, jobs report ok, the blotter fills — and nothing on this screen tells you which of the thirty services behind it is about to fail. You take the desk from here.
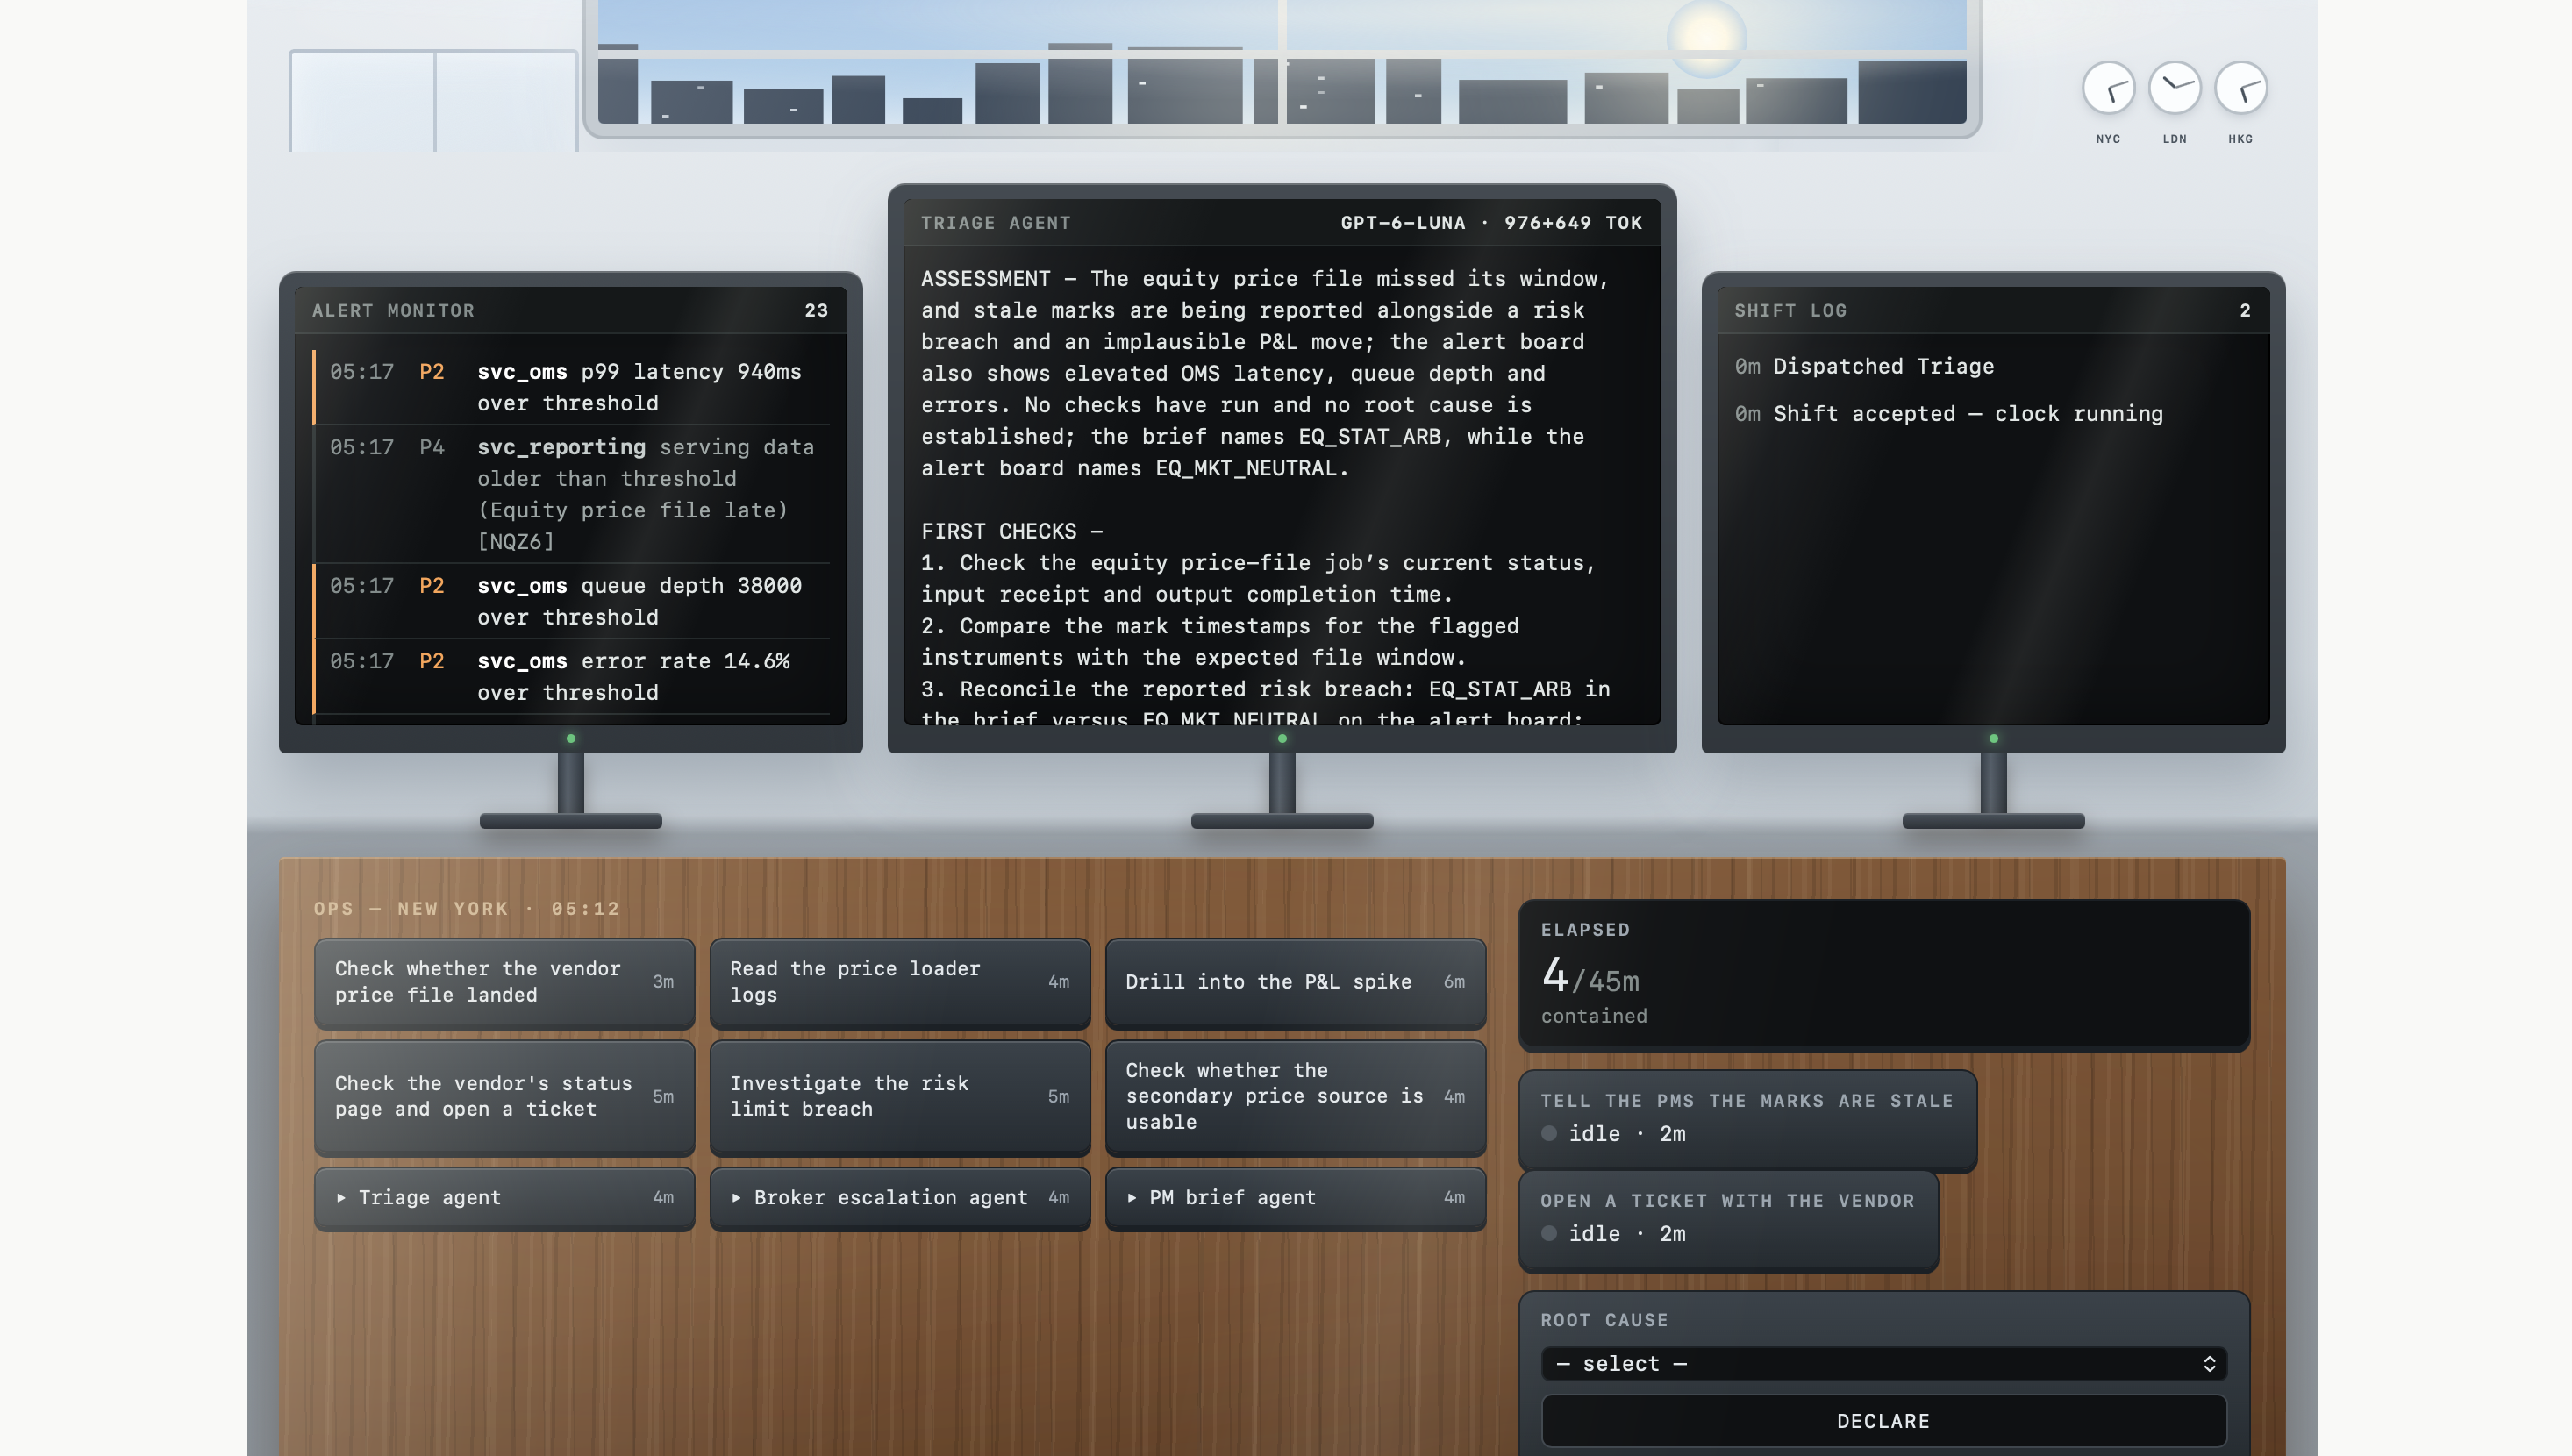
THE DESK · 05:12 NEW YORK4 of 45 minutes spent
Three monitors: an alert monitor listing 23 alerts, the triage agent assessment on the centre screen, and the shift log; below them a desk of timed actions, an elapsed clock reading 4 of 45 minutes, and a root-cause dropdown with a Declare button.
The triage agent has written its assessment to the centre monitor and ranked the first checks — and flagged that the brief names EQ_STAT_ARB while the alert board names EQ_MKT_NEUTRAL. It says plainly that no root cause is established yet. Every action on the desk carries its cost in minutes.
LIVE · 5 SHIFTS · 6 CHECKS EACHTake the shift, and the clock starts
Thirty-three seconds of a shift being worked. The playable version is at exceptiondesk-web.vercel.app — pick a scenario, accept the shift, and the clock starts.
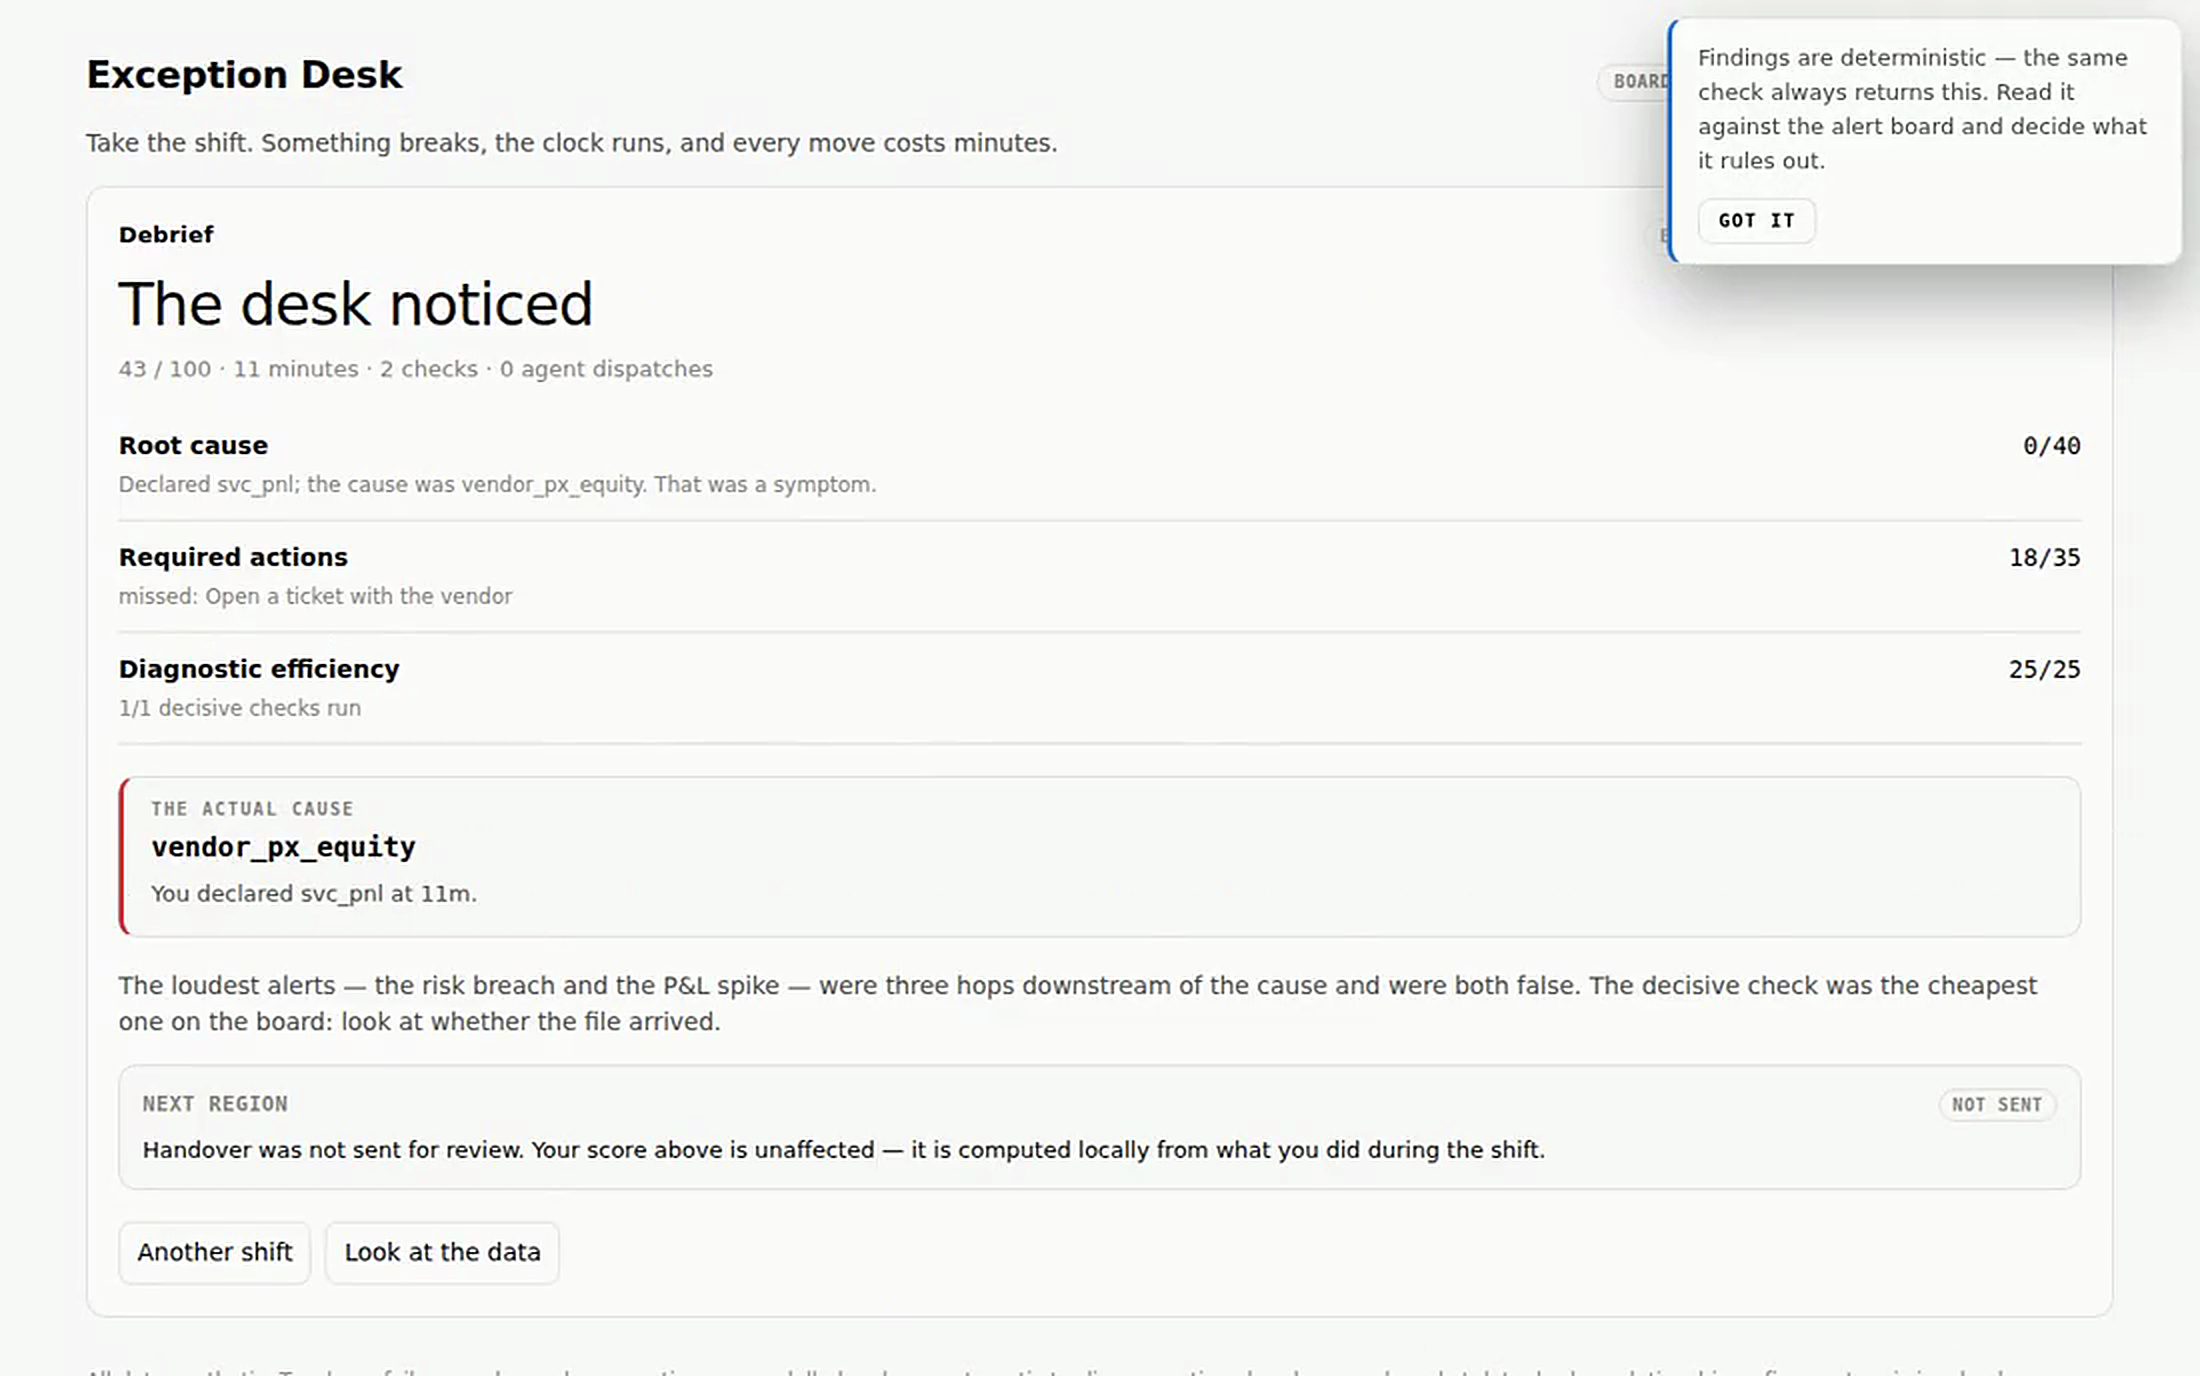
END OF SHIFT · SCOREDdeterministic where it can be
The end-of-shift scorecard headed The desk noticed, showing root cause, required actions 18 of 35, diagnostic efficiency 25 of 25, and the declared root cause vendor_px_equity.
Root cause, required actions and diagnostic efficiency are scored against the answer key. The written handover is the only model-graded part, and the grader is handed an explicit checklist.
!

What is live, and what is not

The simulator is deployed and playable. The correlation engine's scorecard is not yet published alongside it — the metrics that say how often the ranker is right are computed by make eval against the injected ground truth, and that output is not in the current build.

An incident tool that cannot say how often it is wrong is a demo, not a control. That section belongs on this page and it is deliberately absent rather than estimated.

07 / THE OUTCOME

Knowing where not
to put the model.

Two halves that stand on their own: an engine that can show its reasoning, and a simulator that makes someone feel why the reasoning matters.

The engineering result I keep is smaller than the project: three ranking signals specified up front could not separate two services with identical graph positions, and the fact that resolved it — one fired twelve times, the other once — was sitting in the data the whole time. I should have built the per-candidate signal table first. It would have shown the gap in an hour instead of a week.

WHAT'S NEXT

Publish the scorecard with the build, so the accuracy claim on this page is measured rather than described. Then name the scenario the engine still gets wrong, and why.

SOURCE & SCOPE

All data is synthetic. The 30-service topology, the failure modes and the propagation paths are modelled on how systematic trading operations break; no real market data, broker relationship or firm system is involved. Faults are injected at known nodes, which is what makes the ground truth knowable and the scoring meaningful. Checks are deterministic — the same check always returns the same finding. Agents are real model calls when an API key is configured, and they write prose only.

Live simulator ↗Source on GitHub ↗